Golang | Performance Optimization => pprof

Contents
- go tool pprof 用法
- cpu、goroutine、heap 分析方法
pprof
Pprof 是一款可视化的性能分析工具,源自 Google Performance Tools 工具集。用于确定程序运行过程中CPU和内存的使用情况
1
|
go get github.com/google/pprof |
Go runtime 包中内置了 pprof 的性能分析功能,这包含了两部分:
- 每个 Go 程序中内置
runtime/pporf包 - 然后用
go tool pprof来分析性能数据文件
Note: pprof 的选项信息可以参考:golang.org/pkg/net/http/pprof/
使用该工具,有下面几种方式:
- 开发时在程序中加入指令代码,生成分析用的
.profile文件 - 通过web server远程分析程序(不明确产生
.profile文件)
性能概要文件不一定带有
.profile后缀名(文件类型可以自定义)
在开发时生成 .profile 文件分析
CPU 分析
在下面例子中,导入
runtime/pprof包,并增加了相关的API调用,目的是记录 CPU 的数据1 2 3 4 5 6 7 8 9 10 11 12 13 14 15 16 17 18 19 20 21 22 23 24 25package main import ( "log" "os" "runtime/pprof" ) // bigBytes 函数每次分配 100 MB 内存 func bigBytes() *[]byte { s := make([]byte, 100000000) return &s } func main() { pprof.StartCPUProfile(os.Stdout) defer pprof.StopCPUProfile() for i := 0; i < 10; i++ { s := bigBytes() if s == nil { log.Println("oh noes") } } }Note: 为了简单明了,我们使用了 os.Stdout (不在程序中创建文件)而是利用 shell 重定向输出,用于创建性能概要文件。
- 然后编译、运行,将行数据保存到文件:
1$ go build -o app & time ./app > cpu.profile最后,使用 go tool 命令,以交互式的方式检查数据:
1 2 3 4 5 6 7 8 9 10 11 12 13 14 15 16 17 18 19 20 21 22 23 24$ go tool pprof cpu.profile # 可以看到交互式提示符(pprof), 执行 top 命令,输出如下信息: $ go tool pprof cpu.profile File: app Type: cpu Time: Jun 6, 2018 at 4:49pm (CST) Duration: 200.77ms, Total samples = 80ms (39.85%) Entering interactive mode (type "help" for commands, "o" for options) (pprof) top Showing nodes accounting for 80ms, 100% of 80ms total Showing top 10 nodes out of 15 flat flat% sum% cum cum% 70ms 87.50% 87.50% 70ms 87.50% runtime.memclrNoHeapPointers 10ms 12.50% 100% 10ms 12.50% runtime.heapBitsForObject 0 0% 100% 80ms 100% main.main 0 0% 100% 70ms 87.50% runtime.(*mheap).alloc 0 0% 100% 10ms 12.50% runtime.gcAssistAlloc 0 0% 100% 10ms 12.50% runtime.gcAssistAlloc.func1 0 0% 100% 10ms 12.50% runtime.gcAssistAlloc1 0 0% 100% 10ms 12.50% runtime.gcDrainN 0 0% 100% 70ms 87.50% runtime.largeAlloc 0 0% 100% 80ms 100% runtime.main (pprof)Note: 这表示
runtime.memclrNoHeapPointers占用了最多的CPU时间- 我们一行一行的分解程序,可以更准确地观察 CPU 的使用情况。
使用
list命令,通过main.main可以看到主函数 main:1 2 3 4 5 6 7 8 9 10 11 12 13 14 15 16 17# 列出主函数 main 名称空间下的所有函数 (pprof) list main.main Total: 80ms ROUTINE ======================== main.main in /home/code/go_path/src/instance.go.com/performance/pprof/main.go 0 80ms (flat, cum) 100% of Total . . 14: "runtime/pprof" . . 15:) . . 16: . . 17:// bigBytes ?????? 100M ?? . . 18:func bigBytes() *[]byte { . 80ms 19: s := make([]byte, 100000000) . . 20: return &s . . 21:} . . 22: . . 23:// Case3: ?? Web ?????? . . 24:// func main() { (pprof)Note: Now, 可以看到 80ms 都花费在
bigBytes函数。在 bigBytes 函数中,绝大部分时间花费在分配内存命令上 make([]byte, 100000000)
内存分析
收集内存分配信息,需要调整程序:把 StartCPUProfile 替换为 WriteHeapProfile (并把这个调用移到 main 函数的底部,确保内存已经分配了;如果在 main 函数顶部调用,内存分配还没有开始),并且删掉 StopCPUProfile 调用。(通过快照的方式记录堆的使用情况,而不是像CPU性能分析那样,是一个持续运行的过程):
|
|
编译、执行程序,并重定向 stdout 到文件(为了简单起见),如果你愿意,也可以在程序中动态创建一个文件
1$ go build -o app && time ./app > mem.profile- 然后运行 pprof 程序,以交互式方式查看内存分析数据:
1 2 3 4 5 6 7 8 9$ go tool pprof mem.profile # 运行 top 命令,可以看到下面的输出: (pprof) top Showing nodes accounting for 95.38MB, 100% of 95.38MB total flat flat% sum% cum cum% 95.38MB 100% 100% 95.38MB 100% main.bigBytes /...ain.go (inline) 0 0% 100% 95.38MB 100% main.main /.../profiling/main.go 0 0% 100% 95.38MB 100% runtime.main /.../runtime/proc.goNote: 因为是个简单的示例程序,可以很清晰地看出主要的内存分配发生在 main.bigBytes 函数中。
- 执行 list main. 可以查看更详细的内存数据, 逐行支持内存的分配情况
1 2 3 4 5 6 7 8 9 10 11 12 13 14 15 16 17 18 19 20 21 22 23 24 25 26 27 28 29 30 31 32(pprof) list main.main Total: 80ms ROUTINE ======================== main.main in /home/code/go_path/src/instance.go.com/performance/pprof/main.go 0 80ms (flat, cum) 100% of Total . . 14: "runtime/pprof" . . 15:) . . 16: . . 17:// bigBytes ?????? 100M ?? . . 18:func bigBytes() *[]byte { . 80ms 19: s := make([]byte, 100000000) . . 20: return &s . . 21:} . . 22: . . 23:// Case3: ?? Web ?????? . . 24:// func main() { (pprof) (pprof) list main. Total: 80ms ROUTINE ======================== main.main in /home/code/go_path/src/instance.go.com/performance/pprof/main.go 0 80ms (flat, cum) 100% of Total . . 14: "runtime/pprof" . . 15:) . . 16: . . 17:// bigBytes ?????? 100M ?? . . 18:func bigBytes() *[]byte { . 80ms 19: s := make([]byte, 100000000) . . 20: return &s . . 21:} . . 22: . . 23:// Case3: ?? Web ?????? . . 24:// func main() { (pprof)通过 Web 服务器远程分析
/debug/pprof适合在开发的时候进行分析,从运行到结束。但是如果应用已经在数据中心运行,我们希望远程启用调试进行在线分析,这种情况,可以通过 http 远程调试。引入 net/http/pprof 包,并改写代码
修改代码,建立一个 web 服务器,并导入
net/http/pprof包, 以实现自动分析:Note: 如果程序中已经使用了 web 服务器,则不需要在新建一个。pprof 包会挂载到 Web 服务的多路复用器(multiplexer)
1 2 3 4 5 6 7 8 9 10 11 12 13 14 15 16 17 18 19 20 21 22 23 24 25 26 27 28 29 30package main import ( "fmt" "log" "net/http" _ "net/http/pprof" "sync" ) // bigBytes allocates 10 sets of 100 megabytes func bigBytes() *[]byte { s := make([]byte, 100000000) return &s } func main() { var wg sync.WaitGroup go func() { log.Println(http.ListenAndServe("localhost:6060", nil)) }() for i := 0; i < 10; i++ { s := bigBytes() if s == nil { log.Println("oh noes") } } wg.Add(1) wg.Wait() // 为了 pprof 分析的正常运行,阻止 `main` 函数退出 }
如果使用了定制的 URL 路由提供 pprof 分析,则需要单独注册 pprof 端点(endpoint)
|
|
Note: 基于 httprouter 的 pprof
编译、运行这个程序,通过路径 /debug/pprof 可以访问性能分析数据
完整路径:http://localhost:6060/debug/pprof/ (在浏览器运行后,可以看到类似下面的内容:)
|
|
Note: 这里的 block、goroutine、heap、mutex、threadcreate 都是链接到相应的据,这些链接对应不同的 .profile 文件。处理 .profile 文件还需要其他工具: 首先,先认识一下这五个分析文件的含义:
- block: 同步原语引起阻塞的跟踪信息
- goroutine:所有当前 go 协程的跟踪信息
- heap: 堆内存分配情况
- mutex:竞争互斥的跟踪信息
- treadcreate: 创建操作系统线程的跟踪信息
使用 go tool pprof 进行分析
Then use the pprof tool to look at the heap profile:(内存性能分析数据)
1go tool pprof http://localhost:6060/debug/pprof/heap
在 /debug/pprof/heap 页面的最下方,是 runtime.MemStats,这是你的应用真实使用内存的情况(不仅仅是分配)。其中的 HeapSys 是应用从系统申请到的页面数量。
Or to look at a 30-second CPU profile: (30s CPU 性能分析数据)
1go tool pprof http://localhost:6060/debug/pprof/profile
该文件不能在浏览器中展示,但可以下载到本地
Or to look at the goroutine blocking profile, after calling runtime.SetBlockProfileRate in your program:(阻塞性能分析数据:)
1go tool pprof http://localhost:6060/debug/pprof/block
Or to collect a 5-second execution trace:
1wget http://localhost:6060/debug/pprof/trace?seconds=5
Or to look at the holders of contended mutexes, after calling runtime.SetMutexProfileFraction in your program:
1go tool pprof http://localhost:6060/debug/pprof/mutex
在访问 /debug/pprof/ 时,看不到 CPU 性能分析的链接。因为做CPU性能分析需要调用特殊的API(也就是 StartCPUProfile 和 StopCPUProfile 函数),只有调用后才产生流输出,最终下载到本地系统。
Web服务器可以产生”追踪”文件, 访问 http://localhost:6060/debug/pprof/trace?seconds=5 (与CPU性能分析的原因一样,都没有列出来,调用后才会动态的生成数据,然后下载到本地系统)。该追踪文件需要使用 go tool trace 进行解析
Note: 采用命令行的方式进行性能分析,显然很不直观,性能分析更好的是使用可视化分析。可以在交互模式下执行 web 命令,这样会生成一个 svg 文件,然后用浏览器或者其它工具打开。
内存性能分析
在命令行执行下面命令:
1
|
go tool pprof http://localhost:6060/debug/pprof/heap |
然后,就可以看到交互式的提示符:
|
|
Note: Type 有两种表示类型(inuse_space & alloc_space), 可以通过 go tool pporf -inuse_space | -alloc_space http://localhost:6060/debug/pprof/heap 进行切换
- inuse_space: 分析程序常驻内存的占用情况;
- alloc_space: 分析程序在整个生命周期分配的内存数量(累计分配的内存)
还有一些有用的交互式命令:
- top:
- 以文本形式输出最前面的记录
- topk | top K:
- K 代表数字,列出最前面的 K 条记录(例如:top 2)
- top -cum:
- 当不明确调用是被哪些函数引起的时,我们可以输入top -cum来查找
- -cum的意思就是,将函数调用关系 中的数据进行累积,比如A函数调用的B函数,则B函数中的内存分配量也会累积到A上面,这样就可以很容易的找出调用链。
- list:
- 以文本形式输出记录
- web:
- 将结果以 svg 文件格式输出到浏览器进行查看(web命令默认采用 svg 格式的文件,当然还可以生成其他格式的文件: -png、-gif、-pdf 或 -svg 标签)
例如,执行 top 后,可以看到下面的输出:
|
|
- 对于一个简单的应用程序,可以很好指出哪个函数最耗内存(在本例中, main.bigBytes 函数分配内存最多
如果做更精确的分析,可以用 list main.main:
|
|
- 这样可以“逐行”指出内存使用情况。(Note: 以内存性能分析都是在 Type: inuse_space 模式下进行的)
执行下面命令,切换到 Type: alloc_space 看看具体的数据表示:
1
|
go tool pprof -alloc_space http://localhost:6060/debug/pprof/heap |
然后执行 list, 可以看到区别:
|
|
Note: 在考察垃圾回收性能时,需要使用 -alloc_space 进行分析。
可视化分析 (以图片方式)
执行一下命令得到可视化分析结果:
|
|
内存分析可视化图:
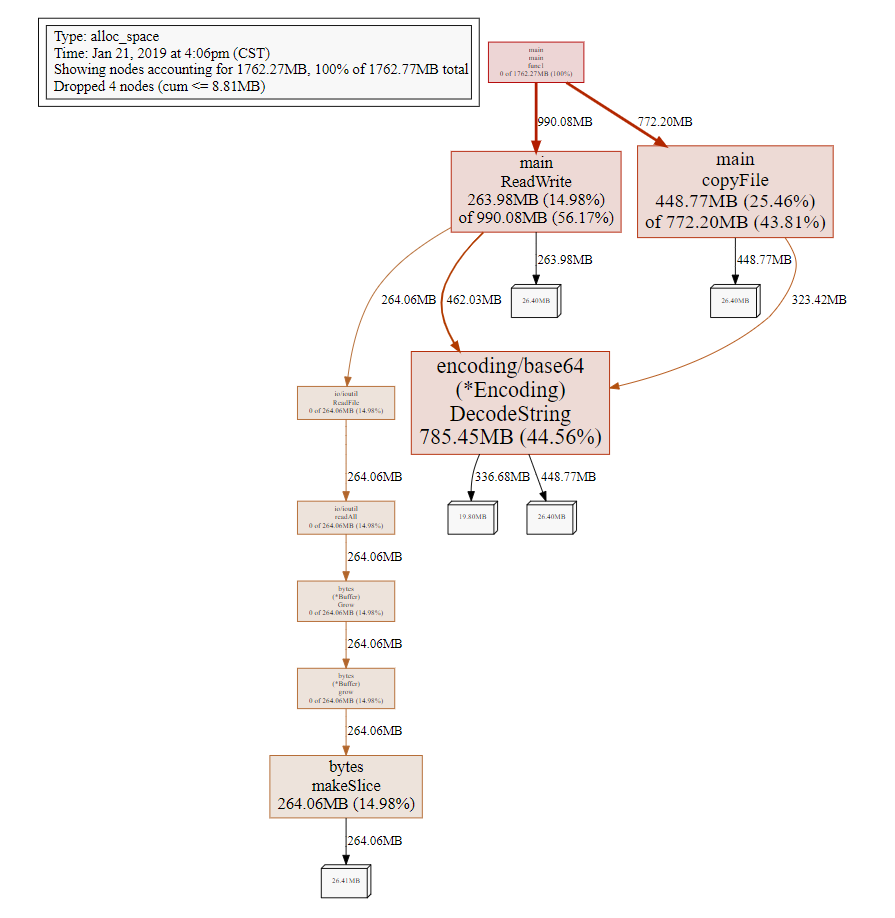
内存分析可视化图说明:
- 每一个方框为 pprof 记录的一个函数调用栈
- 指向方块的箭头上的数字为:记录的该栈累积分配的内存数量
- 从方块指出的箭头上的数字为: 该函数调用的其他函数累计分配的内存, 他们之间的差值可以简单理 解为本函数除调用的其它函数外,自身分配的内存。方块内部的数字也体现了这一点,其数字为:
(自身分配的内存 of 该函数累计分配的内存)Note: 在上面图片中方框的大小表示消耗内存资源的多少:方框越大表示消耗的资源越多,也就代表着问题
此外,除了可视化内存性能分析外,同样可以以可视化方式分析CPU和阻塞。
CPU 性能分析
推荐阅读链接:
- Profiling Go programs
- https://software.intel.com/en-us/blogs/2014/05/10/debugging-performance-issues-in-go-programs
执行一下命令得到 30s 的 CPU 性能分析可视化结果:
|
|
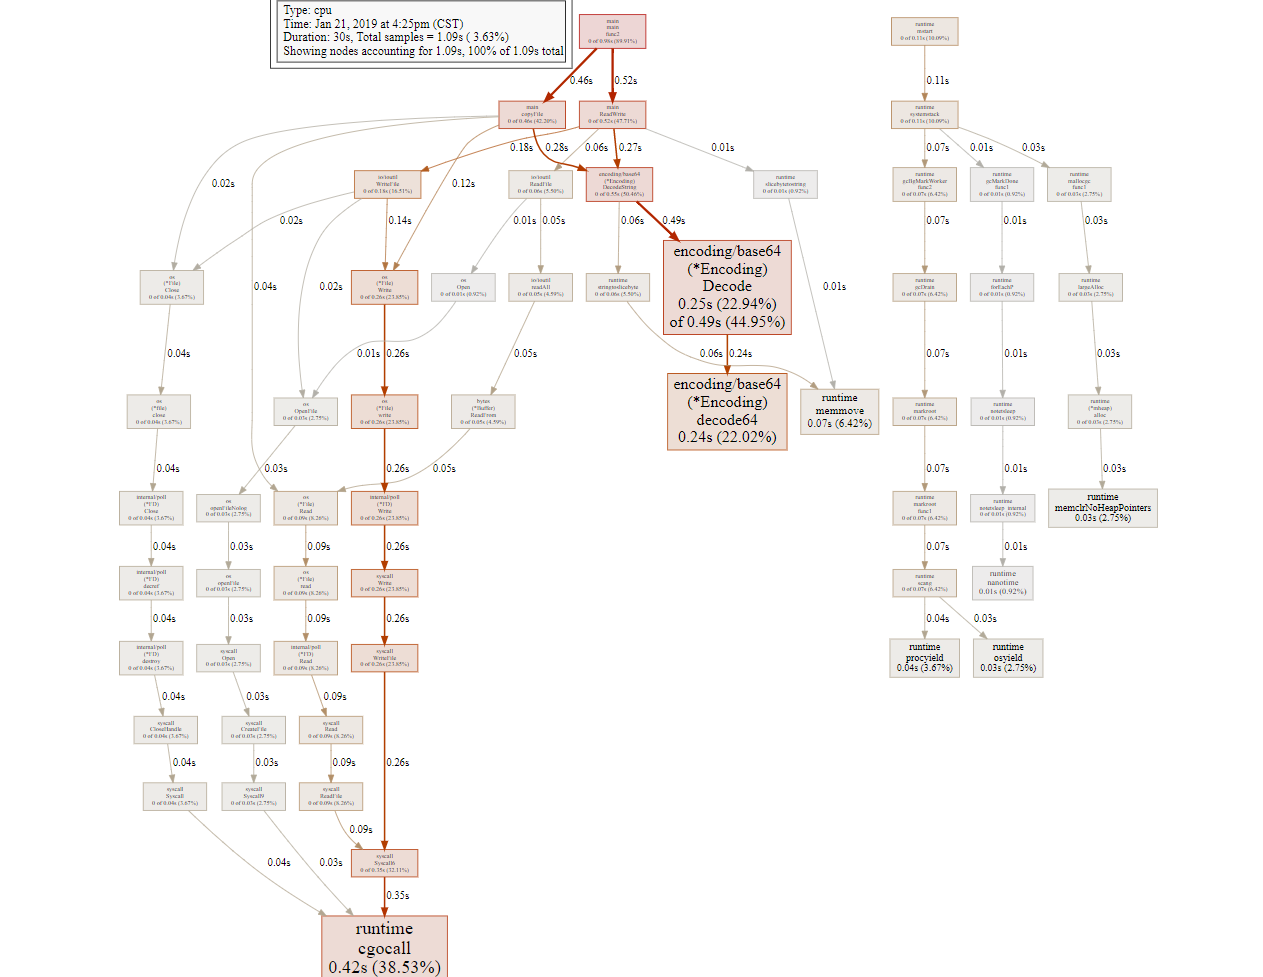
Note: 图中,方框面积越大, 表明使用的时间越多,即消耗CPU也就越多,也可以清晰的看到对象间的继承关系
阻塞性能分析
执行一下命令得到可视化分析结果:
|
|
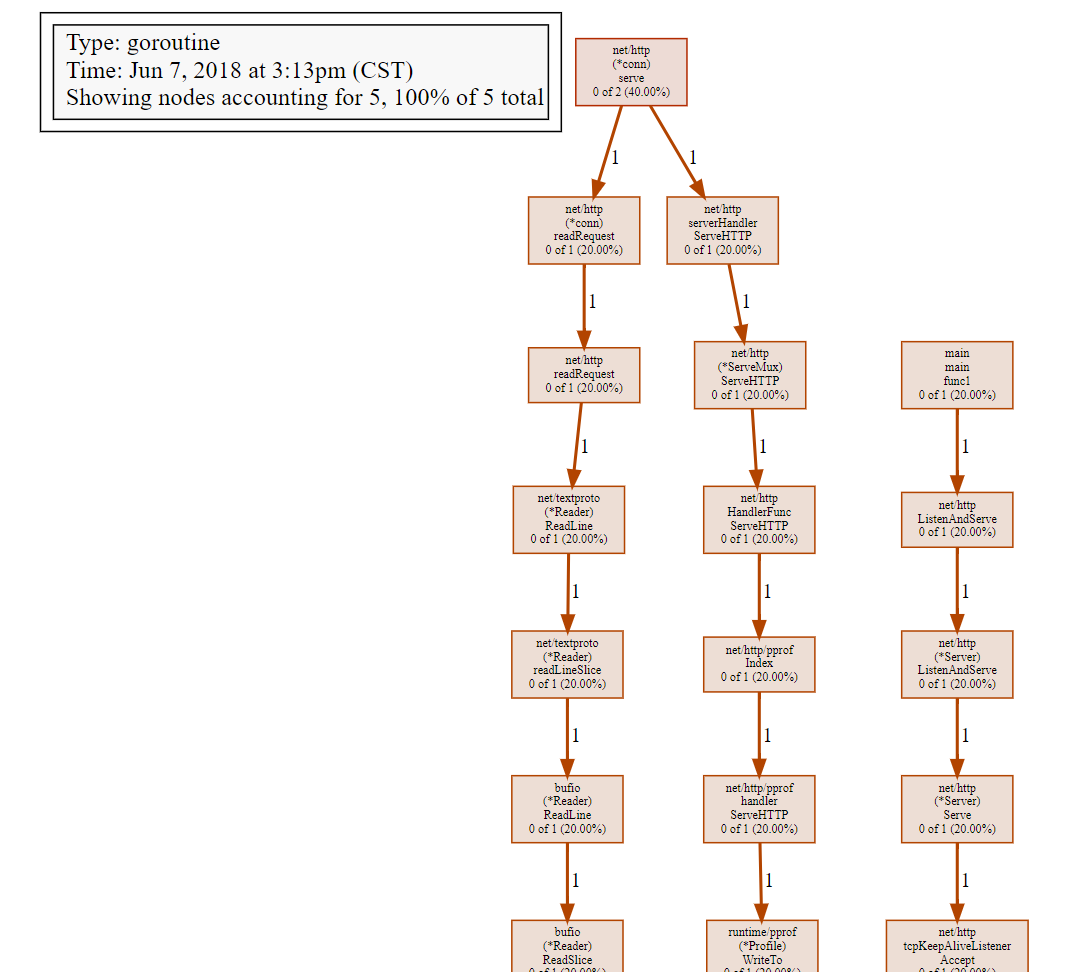
Goroutine 性能分析
执行一下命令得到可视化分析结果:
|
|
Web UI 界面
Issues
Q1: 内存分析没有结果?
|
|
Q2: 分析结果生成图像是出错
|
|
See Also
Thanks to the authors 🙂