Golang | Performance Optimization => go tarch 学习笔记

Contents
- go tarch(火焰图)学习笔记
火焰图(Flame Graph)
火焰图 也是性能分析的利器。最初是由 Netflix 的 Brendan Gregg 发明并推广的。
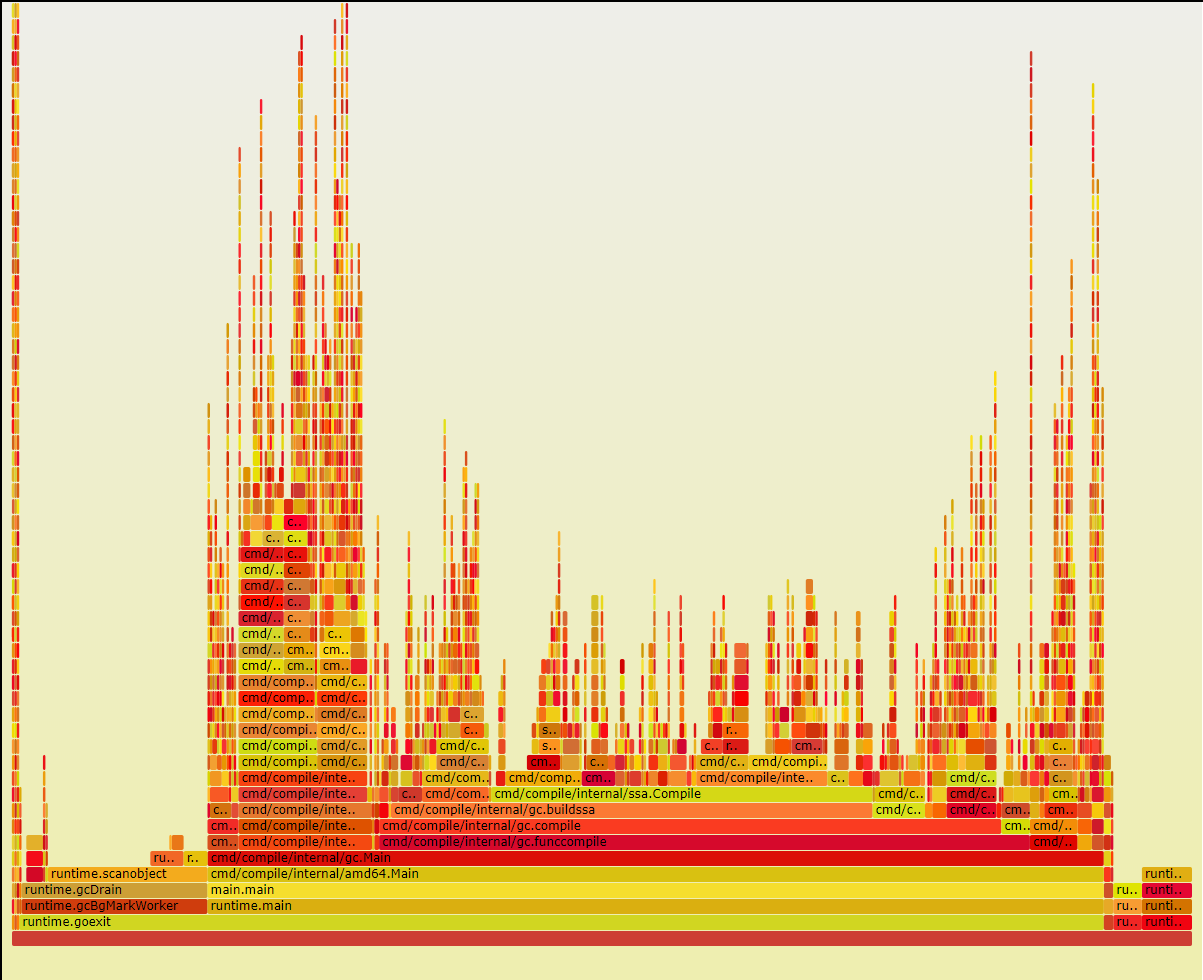
图片来自:blog.lab99.org
火焰图说明:
X轴显示的是在该性能指标分析中所占用的资源量: 即横向越宽,则意味着该指标占用的资源就越多Y轴栈帧(Stack frame,调用链)垂直堆叠, 显示的是调用栈的深度- 如果一个方法被调用者调用了多次, 那么它也会显示多次, 且分列在不同调用者的堆栈上(注:这点和 pprof 工具不同,pprof 只显示了一个方法的框,上面的时间标签是所有的调用者调用的时间)
- 火焰图的调用顺序
从下到上, 每一个方块代表一个函数, 方块上面的一层表示该函数会去调用那些函数 - 需要注意的几点:
左右顺序不重要,X 轴不是按时间顺序发生的,而是按字母顺序排序的- 虽然很好看,但是和
颜色深浅没关系,颜色是随机生成的
火焰图可以来自于很多数据:包括 pprof & perf, 且 go-torch 和 pprof 一样,它也采用 30 秒的采样数据生成火焰图
安装 go-torch
https://github.com/uber/go-torch
Install go-torch
1
|
$ go get github.com/uber/go-torch |
Get the flame graph script
FlameGraph 是 profile 数据的可视化层工具,已被广泛用于 Python 和 Node
1 2 |
$ cd $GOPATH/src/github.com/uber/go-torch $ git clone https://github.com/brendangregg/FlameGraph.git |
Set PATH:检出完成后,把 flamegraph.pl 拷到我们机器环境变量\$PATH 的路径中去,例如:
1
|
$ cp flamegraph.pl /usr/local/bin |
Check
在终端输入 flamegraph.pl -h 检查是否安装 FlameGraph 成功
1 2 3 4 5 6 7 8 9 10 11 12 13 14 15 16 17 18 19 20 21 22 23 24 25 26 |
$ flamegraph.pl -h
Option h is ambiguous (hash, height, help)
USAGE: /usr/bin/flamegraph.pl [options] infile > outfile.svg

    --title TEXT     # change title text
    --subtitle TEXT  # second level title (optional)
    --width NUM      # width of image (default 1200)
    --height NUM     # height of each frame (default 16)
    --minwidth NUM   # omit smaller functions (default 0.1 pixels)
    --fonttype FONT  # font type (default "Verdana")
    --fontsize NUM   # font size (default 12)
    --countname TEXT # count type label (default "samples")
    --nametype TEXT  # name type label (default "Function:")
    --colors PALETTE # set color palette. choices are: hot (default), mem,
                     # io, wakeup, chain, java, js, perl, red, green, blue,
                     # aqua, yellow, purple, orange
    --hash           # colors are keyed by function name hash
    --cp             # use consistent palette (palette.map)
    --reverse        # generate stack-reversed flame graph
    --inverted       # icicle graph
    --negate         # switch differential hues (blue<->red)
    --notes TEXT     # add notes comment in SVG (for debugging)
    --help           # this message

    eg,
/usr/bin/flamegraph.pl --title="Flame Graph: malloc()" trace.txt > graph.svg |
go-torch 使用
go-torch 工具的使用非常简单,没有任何参数的话,它会尝试从 http://localhost:8080/debug/pprof/profile 获取 profiling 数据。它有三个常用的参数可以调整:
- -u –url:要访问的 URL,这里只是主机和端口部分
- -s –suffix:pprof profile 的路径,默认为 /debug/pprof/profile
- –seconds:要执行 profiling 的时间长度,默认为 30s
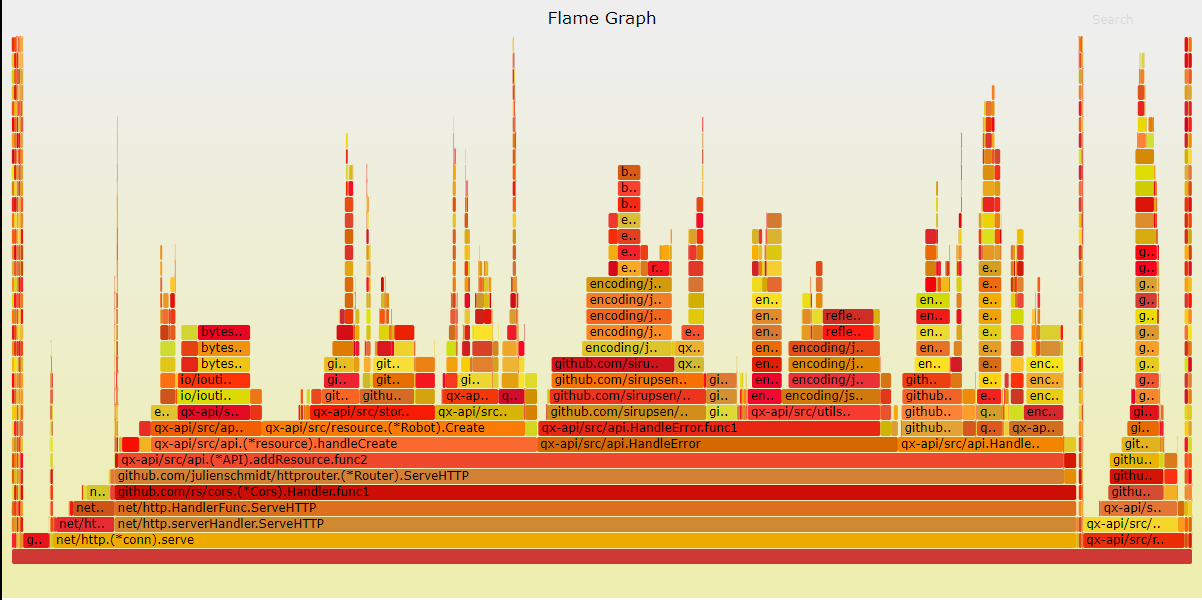
使用 go-torch 分析 API 项目内存分配情况
1 2 |
$ go-torch -alloc_space http://127.0.0.1:8080/debug/pprof/heap --colors=mem $ go-torch -inuse_space http://127.0.0.1:8080/debug/pprof/heap --colors=mem |
alloc_space:
Note:
- -alloc_space/-inuse_space 参数与-u/-b 等参数有冲突,使用了-alloc_space/-inuse_space 后请将 pprof 的 资源直接追加在参数后面,而不要使用-u/-b 参数去指定,这与 go-torch 的参数解析问题有关,看过其源码后既能明白
- 同时还要注意,分析内存的 URL 一定是 heap 结尾的,因为默认路径是 profile 的,其用来分析 cpu 相关问题
这张图,就像一个山脉的截面图,从下而上是每个函数的调用栈,因此山的高度跟函数 调用的深度正相关,而山的宽度跟使用/分配内存的数量成正比。我们只需要留意那些宽而平的山顶,这些部分通常是我们 需要优化的地方。
See Also
Thanks to the authors 🙂